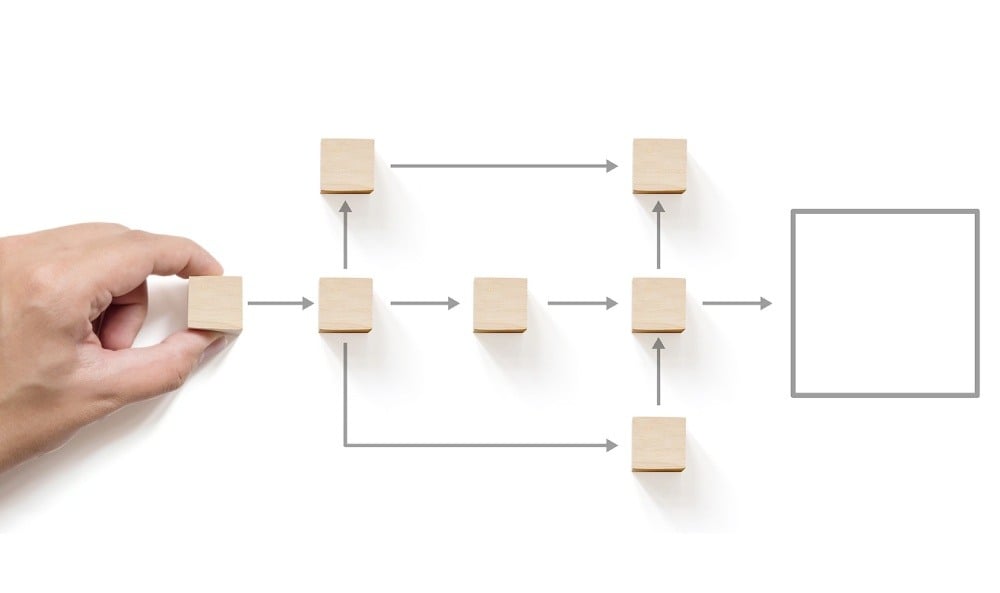
Process mapping is a powerful tool for any business, particularly small and medium-sized enterprises (SMEs), where broad operational responsibility falls upon just a few people. The absence of it leads to a lack of clarity in business operations, obscuring improvements and obfuscating the systems that work.
Why is process mapping important?
Process mapping helps decision-makers visualise and understand each step involved in core business processes, identify areas for improvement, and boost efficiency and productivity. Process mapping typically involves creating detailed diagrams or flowcharts representing the sequence of steps, decisions, and actions taken to complete key tasks or meet objectives.
What are the benefits of business process mapping?
By documenting processes, businesses can identify inefficiencies, redundancies, and bottlenecks that may hinder productivity and performance.
It enables businesses to:
- streamline operations
- improve communication
- enhance overall efficiency
- facilitate better compliance with regulatory standards
- train new employees by providing a clear and concise understanding of their roles
How process mapping is changing
Business process mapping continually evolves from simple flowcharts used in the early 20th century to sophisticated software tools available today. The need for better management practices and the rise of quality improvement methodologies has driven its development.
Thanks to new and improved technologies and tools, effective and detailed process mapping is no longer a luxury afforded only by large companies with an army of data scientists at their disposal.
Today, many accounting software options provide multiple diagram options to visualise process maps, so every business type, size and requirements can be accommodated.
Examples of business process maps
Process maps can include various features depending on their purpose and required complexity. Below are some examples of different process maps and how they can be used.
Flowcharts
A flowchart is a simple visual representation of a process, showing the various sequential steps and decisions that make up a process from start to finish. The goal is to create a clear and user-friendly guide that anyone can follow, making it easier to identify inefficiencies and reduce errors.

Swimlane diagrams
Swimlane diagrams are an expanded variation of standard flowcharts. Like flowcharts, they depict the various steps of a process and separate them based on who is responsible for each aspect of the process. The main purpose of these is to provide a visual guide to accountability.

Image source: What is a Swimlane Diagram? | FigJam by Figma
Data Flow Diagrams (DFDs)
Data flow diagrams map out the flow of information through a system or process. They typically use symbols like rectangles, circles, and arrows to show data inputs, outputs, storage points, and the pathways between them.
Data flow diagrams aim to improve communication between technical and non-technical audiences by providing a clearer understanding of how data flows.

SIPOC diagrams
A SIPOC diagram is a tool used in business process management that helps users understand and improve processes. SIPOC stands for Suppliers, Inputs, Processes, Outputs, and Customers. It's a visual way to map out these five elements of a business process, giving a high-level overview of what goes into the process, what it does, and who gets the results.
This tool is particularly useful for managing and accessing quality and is especially popular with data-driven methodologies.
.jpg?width=660&height=372&name=sipoc%20(1).jpg)
Image source: What Is A SIPOC Diagram | Gemba Academy
Workflow Diagrams
Workflow diagrams are like flowcharts, focusing on how information or documents move through a process rather than how materials flow. They show complex business processes, such as order fulfilment or customer service.

Value stream maps
A value stream map is a visual tool used in lean management to identify waste and improve the flow of delivering a product or service to a customer. It maps all the steps involved, highlighting what adds value and where there's room for improvement.

Image source: Steps to Powerful Value Stream Mapping (projectengineer.net)
How to choose the correct process map
When selecting a process map, it's important to assess the business's specific requirements. The following are some key factors to consider when trying to determine the most suitable process map:
- The complexity of the process: Identify whether the process is simple or intricate to choose an appropriate map that effectively captures its nuances.
- The level of detail required: Determine the depth of information needed to ensure that the selected process map provides the appropriate level of detail for its intended purpose.
- The audience for the process map: Understand who will be using the process map to ensure that it is presented in a format that is understandable and relevant to the intended audience.
How Genus can help
The Genus team will provide a detailed breakdown of each task by carefully mapping out your processes. Our process mapping service will show you exactly how and when these tasks occur, helping to structure and clarify your financial operations.
We are dedicated to supporting you in establishing the fundamental frameworks necessary for consistent, long-term growth and success.


Alicia Williams
I am the Director of the Genus team at Shorts, a chartered certified accountant and Xero specialist. I specialise in cloud-based accounting solutions, particularly Xero and add-on software, helping clients streamline processes and improve efficiency. As a Client FD, I work closely with businesses to give them a clear understanding of their current position and support their long-term planning and growth.
View my articles